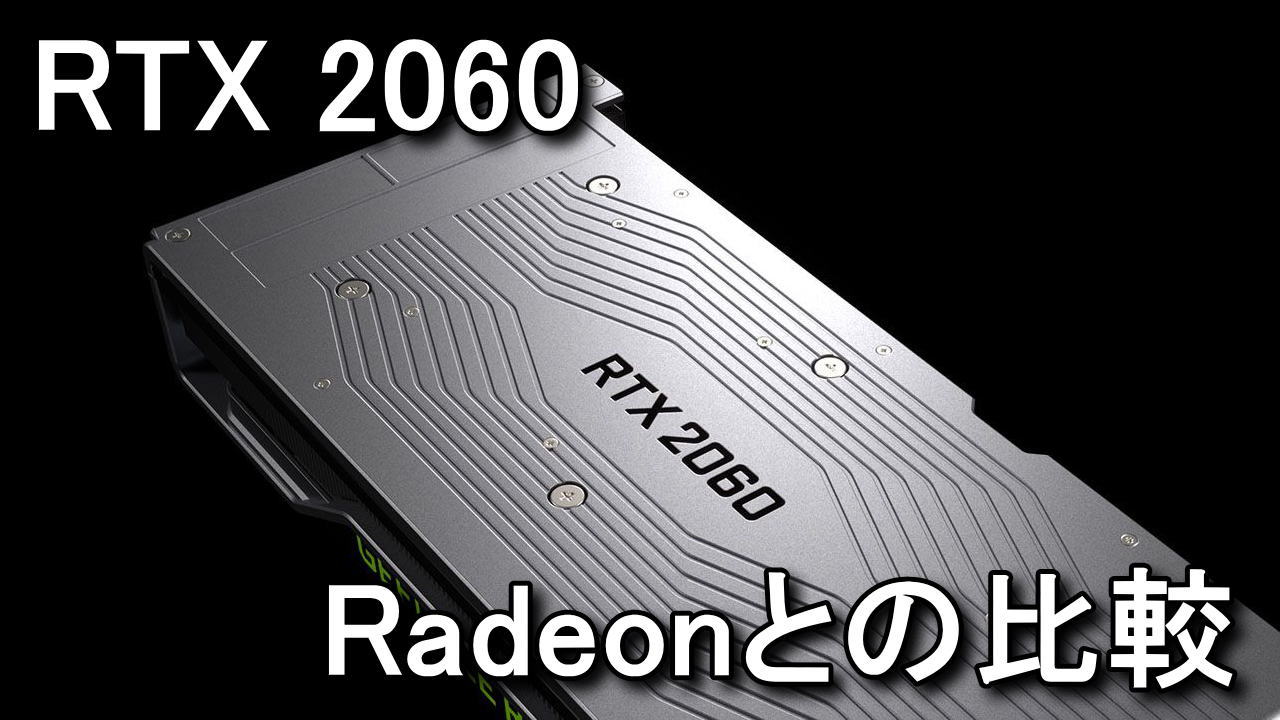
Pascalを採用した前世代のハイエンドGPUである、GeForce GTX 1080と並ぶ性能を持つGeForce RTX 2060。
今回の記事ではこの「RTX 2060」と、RX Vega 64のような「Radeonシリーズ」との性能を比較します。
Radeonシリーズの仕様比較
| 内容(一部項目は最大値) | RX Vega 64 | RX Vega 56 | RX 580 |
|---|---|---|---|
| 演算ユニット | 64 | 56 | 36 |
| 基底周波数 | 1247 MHz | 1156MHz | 1257MHz |
| ブースト周波数 | 1546 MHz | 1471MHz | 1340MHz |
| ピーク時ピクセルフィルレート | 98.9GP/s | 94GP/s | 42.88GP/s |
| ピーク時テクスチャフィルレート | 395.8GT/s | 330GT/s | 192.96GP/s |
| Max Performance | 12.7TFLOPs | 10.5TFLOPs | 6.2TFLOPs |
| Peak Half Precision Compute Performance | 25.3TFLOPs | 21TFLOPs | - |
| Peak Single Precision Compute Performance | 12.7TFLOPs | 10.5TFLOPs | - |
| ROP | 64 | 64 | 32 |
| ストリーミングプロセッサー | 4096 | 3584 | 2304 |
| テクスチャーユニット | 256 | 256 | 144 |
| トランジスター数 | 12.5B | 12.5B | 5.7B |
| メモリー速度(実質) | 1.89Gbps | 1.6Gbps | 8Gbps |
| 最大メモリーサイズ | 8GB | 8GB | 8GB |
| メモリータイプ | HBM2 | HBM2 | GDDR5 |
| メモリーインターフェイス | 2048bit | 2048bit | 256bit |
| 最大メモリー帯域幅 | 483.8GB/s | 410.8GB/s | 256GB/s |
各GPUのフレームレート
| ゲームタイトル名 | RTX 2060 | GTX 1060 6GB | GTX 1060 3GB | RX Vega 64 | RX Vega 56 | RX 580 |
|---|---|---|---|---|---|---|
| Assassin's Creed Origins | 80.9 | 53.2 | 43.2 | 70.1 | 67.1 | 47.3 |
| Battlefield 1 | 139.3 | 94.1 | 42.0 | 156.0 | 128.7 | 94.5 |
| Call of Duty: WWII | 143.7 | 95.6 | 82.5 | 140.0 | 133.4 | 95.1 |
| Dragon Quest XI | 147.3 | 88.9 | 80.1 | 111.6 | 103.1 | 69.3 |
| Far Cry 5 | 107.2 | 73.5 | 68.3 | 117.9 | 111.7 | 69.8 |
| Ghost Recon Wildlands | 60.1 | 40.6 | 34.9 | 57.5 | 54.4 | 39.1 |
| Grand Theft Auto V | 149.0 | 97.2 | 89.9 | 155.0 | 144.4 | 94.3 |
| Monster Hunter World | 78.9 | 44.7 | 40.2 | 79.2 | 72.1 | 49.1 |
| Rainbow Six: Siege | 204.5 | 116.2 | 108.4 | 179.3 | 161.3 | 119.9 |
| Rise of the Tomb Raider | 109.4 | 65.9 | 54.5 | 107.5 | 99.4 | 72.3 |
RX Vega 64基準の対比率
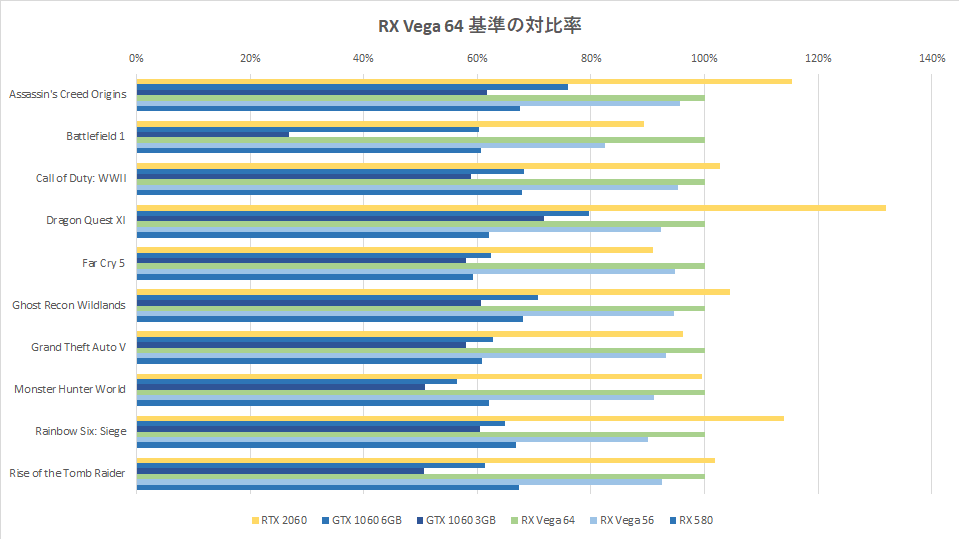
Radeon RX Vega 64の性能はGeForce RTX 2060とほぼ同等ですが、全体的には後者が5%ほど高性能です。
| ゲームタイトル名 | RTX 2060 | GTX 1060 6GB | GTX 1060 3GB | RX Vega 64 | RX Vega 56 | RX 580 |
|---|---|---|---|---|---|---|
| Assassin's Creed Origins | 115% | 76% | 62% | 100% | 96% | 67% |
| Battlefield 1 | 89% | 60% | 27% | 100% | 83% | 61% |
| Call of Duty: WWII | 103% | 68% | 59% | 100% | 95% | 68% |
| Dragon Quest XI | 132% | 80% | 72% | 100% | 92% | 62% |
| Far Cry 5 | 91% | 62% | 58% | 100% | 95% | 59% |
| Ghost Recon Wildlands | 105% | 71% | 61% | 100% | 95% | 68% |
| Grand Theft Auto V | 96% | 63% | 58% | 100% | 93% | 61% |
| Monster Hunter World | 100% | 56% | 51% | 100% | 91% | 62% |
| Rainbow Six: Siege | 114% | 65% | 60% | 100% | 90% | 67% |
| Rise of the Tomb Raider | 102% | 61% | 51% | 100% | 92% | 67% |
| 平均 | 105% | 66% | 56% | 100% | 92% | 64% |
| 差分 | +5% | -34% | -44% | 0% | -8% | -36% |
RX 580基準の対比率
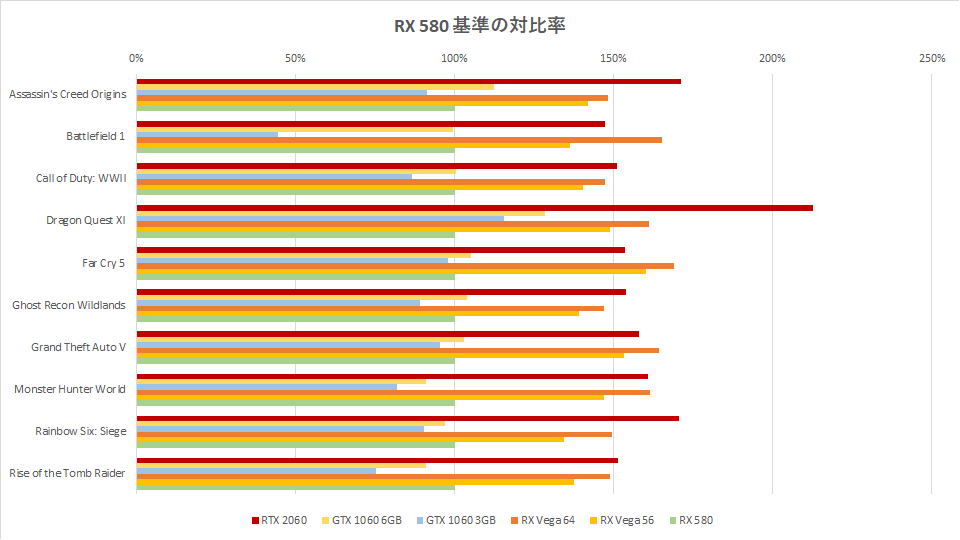
Radeon RX 580の性能はGeForce GTX 1060 3GB以外で劣っており、フルハイビジョンのゲームも厳しめ。
データとして利用したゲームタイトルのうち、3つのタイトルでフレームレート「60fps」を割っています。
| ゲームタイトル名 | RTX 2060 | GTX 1060 6GB | GTX 1060 3GB | RX Vega 64 | RX Vega 56 | RX 580 |
|---|---|---|---|---|---|---|
| Assassin's Creed Origins | 171% | 112% | 91% | 148% | 142% | 100% |
| Battlefield 1 | 147% | 100% | 44% | 165% | 136% | 100% |
| Call of Duty: WWII | 151% | 101% | 87% | 147% | 140% | 100% |
| Dragon Quest XI | 213% | 128% | 116% | 161% | 149% | 100% |
| Far Cry 5 | 154% | 105% | 98% | 169% | 160% | 100% |
| Ghost Recon Wildlands | 154% | 104% | 89% | 147% | 139% | 100% |
| Grand Theft Auto V | 158% | 103% | 95% | 164% | 153% | 100% |
| Monster Hunter World | 161% | 91% | 82% | 161% | 147% | 100% |
| Rainbow Six: Siege | 171% | 97% | 90% | 150% | 135% | 100% |
| Rise of the Tomb Raider | 151% | 91% | 75% | 149% | 137% | 100% |
| 平均 | 163% | 103% | 87% | 156% | 144% | 100% |
| 差分 | +63% | +3% | -13% | +56% | +44% | 0% |
消費電力比較
ゲーム時平均値
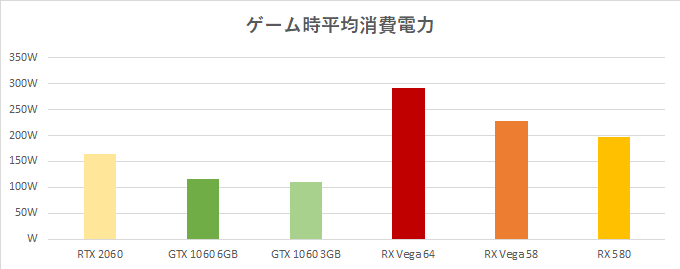
消費電力が高い順:RX Vega 64 > RX Vega 56 > RX 580 > RTX 2060 > GTX 1060 6GB ≧ GTX 1060 3GB
| 消費電力 | RTX 2060 | GTX 1060 6GB | GTX 1060 3GB | RX Vega 64 | RX Vega 56 | RX 580 |
|---|---|---|---|---|---|---|
| ゲーム時平均 | 164W | 116W | 111W | 292W | 229W | 198W |
GTX 1060 3GB基準の対比率
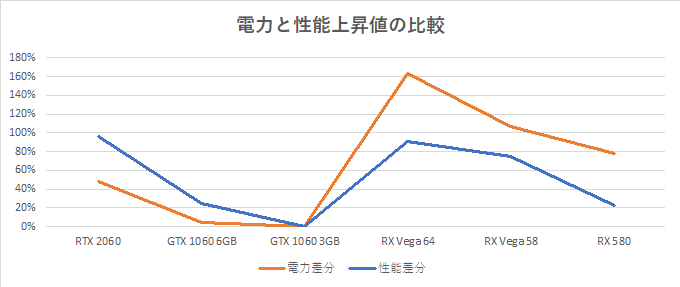
電力差分と性能差分を比べると、Radeonシリーズは電力の増加に比べて性能が上昇していません。
| 消費電力 | RTX 2060 | GTX 1060 6GB | GTX 1060 3GB | RX Vega 64 | RX Vega 56 | RX 580 |
|---|---|---|---|---|---|---|
| 対比率 | 148% | 105% | 100% | 263% | 206% | 178% |
| 電力差分 | +48% | +5% | 0% | +163% | +106% | +78% |
| 性能差分 | +96% | +25% | 0% | +91% | +74% | +22% |
まとめ
- RX 580から「RX Vega 56」に変えると、性能が約44%向上する
- RX 580から「RX Vega 64」に変えると、性能が約56%向上する
- RX 580から「RTX 2060」に変えると、性能が約63%向上する
- RX Vega 64は「RTX 2060」に比べて、5%性能で劣る
- RX 580では、フルハイビジョン設定で60fpsを切ることがある
- Radeonシリーズの消費電力は、性能に比べて著しく高い
参考元:TechPowerUp

🛒人気の商品が日替わりで登場。毎日お得なタイムセール
📖500万冊の電子書籍が読み放題。Kindle Unlimited
🎵高音質な空間オーディオを体験しよう。Amazon Music Unlimited
🎧移動中が学習時間。Audible 30日間無料体験キャンペーン
📕毎日無料で読めるマンガアプリ「Amazon Fliptoon」
